GOOG

The Google Chrome browser user base has increased +300% in 2010 with a conservative count of 120+ million active users
Google Overview
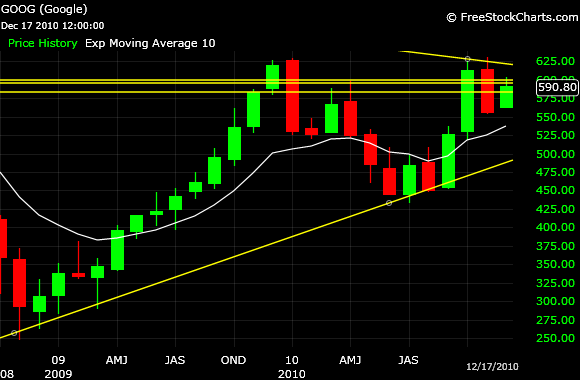
GOOG Google continued below $600 this past week to close at $590.80 on Friday, December 17, 2010. Google was down a slight -0.24% for the week, is up +6.31% for December, and down -4.71% for the year. GOOG is up a market-beating +103.10% since the March 9, 2009 market bottom. This equates to a loss of -$1.41 for the week, up +$35.09 for December, down -$29.18 for the year, and up an incredible +$299.91 since the March 9, 2009 market bottom. GOOG is down -5.74% and -$35.97 from the 2010 YTD closing high of $626.77 on November 8. After struggling in the Bear Abyss below $500, GOOG has been above $500 for 64 consecutive trading days (since September 20), was above $600 for 21 consecutive trading days (from October 15 to November 12), and now has been below $600 for 24 consecutive trading days (since November 15). GOOG finished November down -9.45%, after impressive gains in October +16.72% and September +16.84%.
Moving Averages GOOG rallied above the then descending 20-day simple moving average on December 8 and has been above for 8 consecutive trading days. Google had previously been below the 20d sma for 17 consecutive trading days. GOOG rallied above the descending 25d sma on Monday, December 13. However, GOOG has now dropped below the ascending 50d sma on Wednesday, December 15, which is considered a sell signal by some.
S&P 500 By comparison, the overall market, the S&P 500, was up +0.28% for the week, is up +5.37% for December, is up +11.55% for the year, and is up +83.87% since the March 9, 2009 market bottom. SPX closed at a YTD and multi-year closing high of 1243.91 on Friday, December 17, 2010, the highest close since the September 19, 2008 close of 1255.07. GOOG has been outperforming the market since the March 9, 2009 market bottom, underperforming for 2010, outperformed in September and October, is outperforming barely in December, but lagged the market in November. A review of the S&P 500 is here [S&P 500 at Another 2+ Year High! (Charts) *567 point rally in 648 days*].
Google News and Fundamentals Google has been in the news as a result of the Google Chrome Event on December 7. In addition, Google announced the launch of the Samsung Nexus S Android (Gingerbread OS) smartphone and the opening the eBooks Store. At the Google Chrome Event, the Chrome Web Store was launched, the Chrome Notebook was unveiled which is planned to be consumer-ready by mid-2011 with Acer and Samsung as the first manufacturers, and Google announced the Chrome browser user base had increased +300% in 2010 with a conservative count of 120+ million active users. More innovation is coming for the Chrome browser, based on speed via Chrome Instant. Finally, Andrew Rubin tweeted on December 9 that 300,000 Android phones are being activated daily, which is a blowout number. This was after the negative news that the EU had launched an anti-trust investigation. Google reported excellent Q3 earnings which are reviewed and analyzed on this blog. Q4 2010 is expected to be financially strong. Current Google financial data, charts, and review is at the Google Financial Performance page, updated for the latest Q3 financial results reported on October 14. A review and analysis of the most recent Q3 earnings call is at the Google Earnings Conference Call page. Our valuation and target price of GOOG stock is posted at the Google Stock Valuation page. Revenues from outside of the United States were 52% of total revenues in the third quarter of 2010.
Economic and Market News Information about the USA and world economies is posted at Boom Doom Economy and Financial Controls.
Google Rallies +3.35%
Google Daily Chart Below is the GOOG daily chart since October 14, when Google reported calendar Q3 earnings after market close and gapped up the next day. This is to illustrate the recent applicable price interactions with the current close, resistance, and support. A monthly chart is included at the bottom of this page for a broader perspective.
Noteworthy Closing Prices on Daily Chart Below
Current Close: $590.80
2010 YTD High, November 8: $626.77
2010 YTD Low, July 6: $436.07
YE December 31, 2009: $619.98
* The 200 day simple moving average and the uptrend line are not shown on the daily chart this week The very highest yellow line is the downtrend line discussed below *

Intermediate-Term Trend The intermediate-term signal, the comparison of the 25 day and 50 day simple moving averages, generated a sell signal on Tuesday, December 14, after being in buy mode since September 30. Therefore, GOOG is in an intermediate-term bear market. That is, the 25d sma is now less than the 50d sma. However, the relationship between these two moving averages is a lagging indicator. The 25d sma continues descending (not shown on the daily chart above) while the 50d sma continues ascending.
Resistance GOOG has pulled back from the 2010 YTD closing high of 626.77 on November 8 so there are multiple levels of resistance above. Current resistance continues to be the 595.00 area (middle yellow horizontal line on the daily chart above). This resistance begins with the peak and close on April 15 of 595.30, the November 24 peak and close of 594.97, and the failed breakout attempts on December 9, 13, 14, and 15. The peak and close of 596.56 on November 18 is just above. Next and key resistance is the benchmark price of 600.00 (highest yellow horizontal line on the daily chart above). Buyer conviction and recent positive news did not rally GOOG above 600.00 as support and it is now resistance. GOOG dipped below $600 on the EU anti-trust investigation news.
Support Current support continues to be the 583.00 area (lowest yellow horizontal line on the daily chart above). The closings were 583.72, 583.55, intraday 582.75, 583.01, and 582.11 on November 16, 17, 22, 23, and 29, respectively. The 583.00 price also is support from January 2010 and December 2009. GOOG last tested this support on December 8 with an intraday low of 583.69. Further below, support is the dip to 555.00 on November 30 (close 555.71). This has proven to be the bottom thus far and was the dip related to the news that the EU has launched an anti-trust investigation of Google.
Moving Averages More discussion is above earlier in this post. GOOG is above the leveled off 20-day simple moving average and above the sharply descending 25d sma. GOOG has now dropped below the sharply ascending 50d sma. GOOG continues above the 100 and 200 sma's (the 200d sma is not shown on the daily chart above). The 50d is ascending, regained the 100d sma on September 27, and regained the 200d sma on October 28. The 100d is ascending and regained the 200d sma on November 24. The 200d has leveled off and begun slightly ascending.
Uptrend Line (Not shown on the daily chart this week) The yellow uptrend line, a rate of price ascent, is from the November 24, 2008 closing low of 257.44 up through the July 6, 2010 YTD closing low of 436.07. GOOG broke down through this trendline on August 30 and 31, but bounced above on September 1 and has remained well above since.
Downtrend Line The yellow downtrend line, a rate of price descent, is from approximately the November 6, 2007 all-time closing high of 741.79 down through the November 8, 2010 high of 626.77, the peak YTD closing high so far. GOOG has remained below since.
Relative Strength Index (RSI) The RSI 14 day = 55.99 is reasonable, ascending, and has bounced up from oversold levels as a result of the EU investigation news sell off. The recent low was 17.01 on August 24 and the unbelievable low of 4.79 on July 6. A 2010 YTD high, and multi-year high, of 94.12 was reached on September 27. The RSI 28 day = 39.29 is now oversold and descending. The 2010 and multi-year high was 87.87 on October 18. The 2010 lows have been in the mid-20s. The RSIs had been pulled downwards by the sell off on the EU investigation news and recent sideways trading has kept them low.
MACD (12,26,9) The MACD = +1.07 became positive on December 10, after being negative for 27 consecutive trading days and is descending as a result of the recent sideways trading. The 2010 and multi-year high was +7.27 on October 19. The 2010 and multi-year low was -8.30 on November 17.
MACD (12,26,9) The MACD = +1.07 became positive on December 10, after being negative for 27 consecutive trading days and is descending as a result of the recent sideways trading. The 2010 and multi-year high was +7.27 on October 19. The 2010 and multi-year low was -8.30 on November 17.
Volume GOOG traded a recent high of 3.1M on Friday, December 17, which is above the leveled off 20 day moving average of approximately 2.5M. This hopefully shows some price support for GOOG in the high 580s. The high has been an incredible 14.8M shares on October 15, 2010 (day after Q3 earnings release), a YTD and multi-year high. At the recent bottom of 555.71 on November 30, the volume was a very high 7.1M, which was encouraging and showed buyer support. By comparison, the 50 day sma has leveled off at approximately 3.1M. Buyer conviction and enthusiasm after the earnings report waned and as GOOG approached the 2010 YTD closing high of 626.75.
Long-Term Trend The 10 month exponential moving average of 536.70 is a long-term indicator and shown on the monthly chart below. That is the line in the sand, so to speak, for the long-term signal of a bull or bear market. GOOG rallied above this indicator in September and has stayed above in October, November, and into December. GOOG had been mostly below this long term bear signal from April to August in 2010.
Conclusion On October 14, Google reported excellent Q3 earnings which are reviewed on the Google Financial Performance page A review and analysis of the most recent Q3 earnings call is at the Google Earnings Conference Call page. The Great Google is still an extraordinary cash flow machine! GOOG had rallied with the market and actually outperformed the market during September and October - even before the excellent Q3 earnings announcement. Google has set the bar high for the future and EPS growth. The intermediate-term trend has turned bearish this past week but the the long-term trend is bullish. The line in the sand is $600, which GOOG has dipped below. Will buyer confidence rally GOOG above $600? We think so. More about Google the value of GOOG stock on the Google Stock Valuation page.
Google Monthly Chart
Up +129% and +$333 from November 28, 2008 cyclical closing low of $257.44!
Below is the monthly GOOG chart since the November 2008 cyclical low. The overall analysis and commentary is the same as for the daily chart above. The current price, the yellow horizontal lines, and the yellow uptrend and downtrend lines are the same, and as described, on the daily chart discussion above. The white moving average line is the 10 month exponential moving average of 536.70, which is the long-term bull or bear market signal. GOOG rallied above 10m ema in September 2010 and the current close continues above, indicating a long term bull market.

DisclosureWe are long GOOG.
About Google
Google market capitalization is now 5th largest in the USA at $188.92B, behind #1 Exxon $363.92B and #2 Apple $294.10B. Google is the 3rd largest technology company in the USA by market capitalization behind Apple and Microsoft. Just in the past couple of months, Google was 13th largest overall company and 4th largest technology company by market capitalization, until the spectacular rally on excellent Q3 earnings. Current Google financial data is at the Google Financial Performance page. A review and analysis of the most recent Q3 earnings call is at the Google Earnings Conference Call page. More about Google the value of GOOG stock on the Google Stock Valuation page. Headcount: On a worldwide basis, Google employed 23,331 full-time employees as of September 30, 2010, up from 21,805 full-time employees as of June 30, 2010.
Google describes itself in press releases as, "Google's innovative search technologies connect millions of people around the world with information every day. Founded in 1998 by Stanford Ph.D. students Larry Page and Sergey Brin, Google today is a top web property in all major global markets. Google's targeted advertising program provides businesses of all sizes with measurable results, while enhancing the overall web experience for users. Google is headquartered in Silicon Valley with offices throughout the Americas, Europe and Asia."
Google's Mission Statement: "Google's mission is to organize the world's information and make it universally accessible and useful. The first step toward fulfilling that mission came when our founders, Larry Page and Sergey Brin, working out of a Stanford University dorm room, developed a new approach to online search that quickly spread to information seekers around the globe. Google is now widely recognized as the world's largest search engine -- a free service whose utility and ease of use have made it one of the world's best-known brands almost entirely through word of mouth from satisfied users."
More Charts!
USA and Global economic charts
Apple (AAPL) financial performance and stock charts
Google (GOOG) financial performance and stock charts
Microsoft (MSFT) financial performance charts
Intel (INTC) financial performance charts
VMware (VMW) financial performance charts
SalesForce.com (CRM) financial performance charts
USA failed and problem banks
Federal Reserve statistical releases
JPMorgan Chase & Co. (JPM) financial performance charts
Citigroup (C) financial performance charts
Goldman Sachs (GS) financial performance charts
Wells Fargo (WFC) financial performance charts
Bank of America (BAC) financial performance charts
Morgan Stanley (MS) financial performance charts
S&P 500 (SPX) charts and review
Baidu Planet
Baidu (BIDU) financial performance and stock charts

Baidu Planet
Baidu (BIDU) financial performance and stock charts

Visit Osprey Port Blog Network!

Follow Google Investor On Twitter!
GOOG

No comments:
Post a Comment